Dataset & Analysis
Exploring A Digital Campus’s Student Recruitment at an Organizational Level
In this project, we selected George Mason University to examine the styles and statistics of community recruitment between students and the university activities. We initially aimed to explore community engagement, however since we do not have access to any data that can be used to measure the engagement, nor is this data publicly available or available on request, we decided to focus on the first step of any engagement activity, which is recruitment. George Mason has many organizations and recruits for many events, programs, scholarships, and experiences during the semester. However, we argue that students do not know about all these activities, not the organizations that host them because there is an information access problem.
To understand the problem, we have 1 overarching question we aimed to answer through our project:
How do organizations at George Mason University engage with students through online recruitment efforts?
For us to answer this, we realized it is important to understand if platforms are being used to recruit different interest groups, and whether there are even a variety of groups recruiting online, to begin with. Without knowing what organizers are doing with each platform, it makes it extremely difficult to make recommendations. The explicit questions we intend to answer through this project are:
- What interest categories recruit students on different platforms (Mason360 vs. social media)?
- How diverse are these interest categories on each platform? Currently, there are no statistics, metrics, or recommendations available?
The second part of this project aims to provide recommendations for organization leaders to enhance recruitment and retention. Additionally, students can also gain some understanding of what interest groups are dominant on different platforms. The recommendations will be discussed based on the result of the first question.
The project has been split into different sections for discussion of the data collection, approach, analysis, interesting results, and more:
- Limitations of the Work
- The Data
- But what categories exist? - LDA Analysis
- Our Defined Categories!
- Reducing manual tagging - Word and Phrase Spotting
- Categories + Data = Categorized Data
- Diversity of Events
- So what does this all mean? - Results
Limitations of the Work
There are two primary limitations for this work:
- The data available from the institution is minimal at best. We reached out to different offices at George Mason University and even aggregate or deidentified data is not available.
- The categories, analysis, and recommendations are specifically for George Mason University. At this stage, the project is not wholly generalizable, but this project cannot work to making it so.
The Data
To answer our two questions, we selected two platforms to collect data as our datasets.
Mason360 Dataset
The first dataset is Mason360, an off-the-shelf campus engagement platform for George Mason University powered by Campus Labs. This is a university sanctioned system, and it is used because platforms like this are considered a student success best practice across other institutions.
In Mason360, we are focusing on the events sections instead of organizations, because there is not much information regarding the organization, and when we tried to contact Mason360 to request reported data such as the number of members and social media presence, etc. for each organization, they responded two weeks later and said they do not have this data, and we should contact the organizations individually. This is extremely impractical because there are about 550 organizations, and for this reason we decided to focus on recruitment instead of engagement because we could not access any official data regarding the engagement level in GMU.
Once we defined our scope with Mason360, we started examining the events between September 10 and November 21 by looking at the title of the event, the name of the organization, the date, the location, etc. Our final Mason360 dataset included 1165 events.
Twitter Dataset
For the second dataset, we wanted to include other sources of recruitment that are common for smart and connected communities, such as social media platforms. We used the Twitter API to collect any tweets that included the following criteria: “@GeorgeMasonU OR ‘George Mason University’ OR ‘GMU’ OR ‘George Mason’”. We decided to work with Twitter because the Geroge Mason community is largely active on this platform, and we have access to all the posts Over the same date range.
We collected almost 32,000 tweets and after processing the dataset, we just keep the tweets that related to recruitment which were about 1514 tweets.
But what categories exist? - LDA Analysis
Once we had the datasets, we decided on our analysis methods. Firstly, as we did not have any established categorization, this was the first task to tackle. Mason360 had some tags for categorization, but these were arbitrary and were used for SEO rather than to classify activities. To work around this, we used Latent Dirichlet allocation (LDA), which is an unsupervised technique, to create clusters of similar topics. This technique was conducted on both the datasets. This informed us of our initial exploration of potential categories.
Since LDA is an unsupervised technique, it requires you to include a number of topics, or bins that you want the technique to attempt to distribute. To calculate the optimal number of bins, we used attempted the analysis with different numbers of topics and picked the one with the highest coherence score.
Mason360 Dataset - LDA Results
Below you can explore the results of the LDA attempts at classifying topics for the Mason360 dataset.
Coherence Score: 0.5870
Twitter Dataset Dataset - LDA Results
Below you can explore the results of the LDA attempts at classifying topics for the Twitter dataset.
Coherence Score: 0.4114
Our Defined Categories!
The LDA analysis provided some overarching themes which were refined over time. The final categories created were:
| Interest Category | |
|---|---|
| 1 | Activism/Politics |
| 2 | Admissions/FYE |
| 3 | Alumni |
| 4 | Career/Professional Dev |
| 5 | Cultural/Art |
| 6 | Educational/Awareness |
| 7 | Health/Wellness |
| 8 | Religious |
| 9 | Research/Scholarship |
| 10 | Social/Community |
| 11 | Sports/Games |
Reducing Manual tagging - Word and Phrase Spotting
We then used to create data groups for word spotting. For example, George Mason University has active basketball and baseball teams that fall under our category of “Sports/Games.” A tweet, or event that includes the words “basketball,” “baseball,” “homerun,” has a high likelihood of being within this category, and we systematically categorized as many items based on this.
Code snippet and logic for the word spotting script (all sets are not shown).
# words commonly associated with specific interest categories
sports = ['basketball','baseball','volleyball','football','soccer','tennis',
		  'homerun','stadium', '@MasonMBB', '@MasonWBB', 'Esports']
career = ['internship','hiring']
health = ['mental health','depression', 'anxiety', 'wellbeing', 'exercise', 'stress']
admissions = ['admission', 'early action deadline', 'freshman early action deadline']
For each dataset, we used the word spotting code to attempt to categorize the text by scoring each time a associated word was spotted.
Mason360 Dataset Word Spotting Example
| Event Title | Highest Scored Category | |
|---|---|---|
| 1 | GMU Esports | Sports/Games |
| 2 | Fall Career Fair (In-person) | Career/Professional |
| 3 | Managing Academic Anxiety | Health/Wellness |
Twitter Dataset Word Spotting Example
| Tweet Text | Highest Scored Category | |
|---|---|---|
| 1 | Ready to apply to Mason by the Freshman Early Action Deadline? https://t.co/r9EswesZUx | Admissions/FYE |
| 2 | Multiple spring 2022 fellowship opportunities @USGS which can be applied to EVPP 894 Internship for Graduate Credit. Apply by Oct. 29, 2021. https://t.co/W2AZeFt6fK | Career/Professional Development |
| 3 | On Tues. Nov. 9, at noon ET, join our Leading to #Wellbeing speaker, author @gregorypnelson, in a free session that will show you how to take strategic pauses in the middle of #stress, so you can respond successfully: https://t.co/W4l4YUeGSg #wellbeingatwork #leadership https://t.co/JOqPozwbD8 | Health/Wellbeing |
Categories + Data = Categorized Data
After using both LDA and word spotting, we then used manual thematic coding for each event and post to verify the results of our categorization.
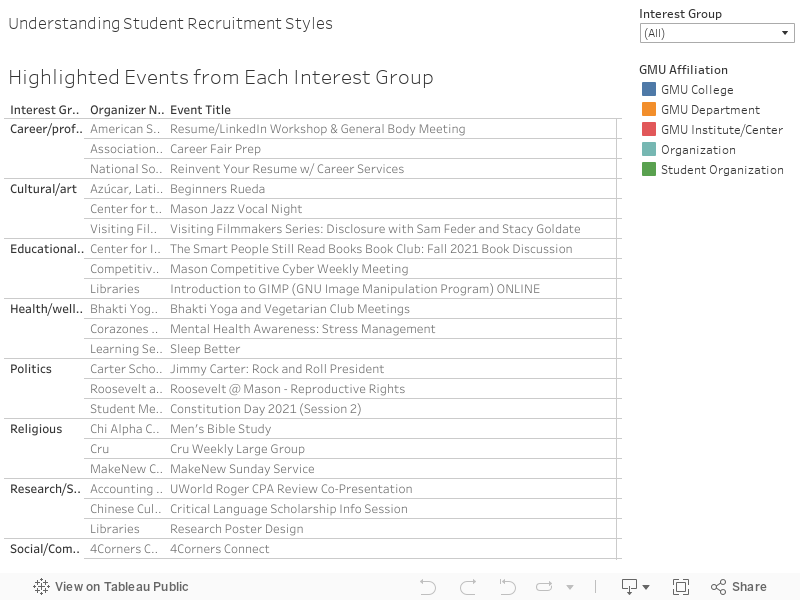
Below are some categorized events from Mason360...
Mason360 Dataset Categorized Data Snippet
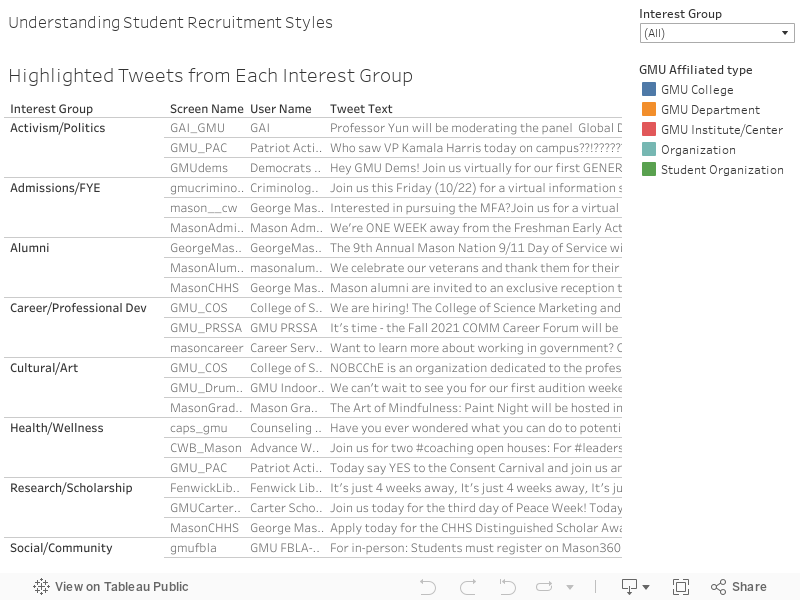
... and here are some categorized tweets from the Twitter dataset.
Twitter Dataset Categorized Data Snippet
Diversity of Events
The next question was exploring the diversity of the interest categories in each data set. Are the data sources actually diverse or are they bogged down by a specific type of activity? Before we look at actual diversity, below is the distribution of the events and tweets respectively for each dataset.
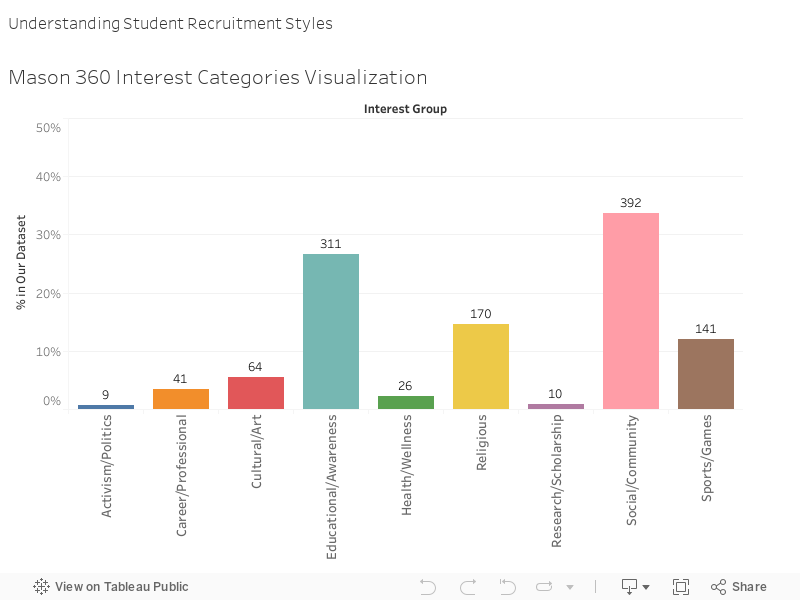
Mason360 Dataset Category Distribution
Twitter Dataset Category Distribution

We measured the reverse HHI for both datasets to test the diversity of the activities because higher diversity means diverse types of activities are available within the community. This will in turn increase the opportunity of all students’ engagement since GMU’s students are diverse and come from different cultures and backgrounds, and each has a different interest.
We calculated the HHI for Mason360 first, and we found that the reversed HHI is .797, which is high. Then we ran it on the Twitter dataset. Interestingly, the reversed HHI is also .774.
So what does this all mean? - Results
From our analysis methods, we can see that organizations at George Mason University are undertaking some recruitment efforts to increase engagement. Overall, both Mason360 and Twitter are being actively used by the organizers to recruit. The large number of events and tweets indicates that this. Additionally, there are a variety of interest groups represented on each platform. The high reversed HHI means that George Mason has a high diversity ofactivities that suit all kinds of students, so the student engagement opportunity might be high as well. However, as we mentioned earlier, we cannot quantify the engagement level. The organizations are recruiting, but we cannot say how well attended any of the events are. Neither can GMU (other than university-led initiatives).
In addition, we found out that there are some recruitment issues in Mason360 and Twitter. Regarding Mason360, the website is an off-the-shelf software platform, so there are limited functionality and resources. Also, the description of each event and organization is poor and unclear. There is no quality assurance with the type of information on Mason360. For example, these are some of the events on the website. (I will add images of the events with not description.). Also, it is not clear for each event whether it is open to everyone or for the organization’s members only. Also, there is no contact information neither for Mason360 or of the organization’s leader, except the main of Mason360 admin that I emailed through the data collection process.
On the other hand, the Twitter recruitment efforts seem to have more functionality than Mason360. Using a social media platform gives the organization freedom to create their brand image, decide on their online persona, and how they want to engage with their members/audience. Social media platforms also allow for spreading more than just recruitment efforts including interest-specific discussion news. This is not possible with the way that Mason360 is designed. However, because there is much flexibility, posts can sound unofficial since they are posts by personal accounts instead of verified accounts. Mason360 is a vetted portal, and so this is not as much of an issue.
This analysis informed the recommendations we provide on our Recommendations page.